Car insurance rates are driven mainly by your driving record, age and experience, where you live, the vehicle, the coverage you buy, annual mileage and, in most states, a credit-based insurance score. Each insurer weights these differently in rating plans filed with state regulators.
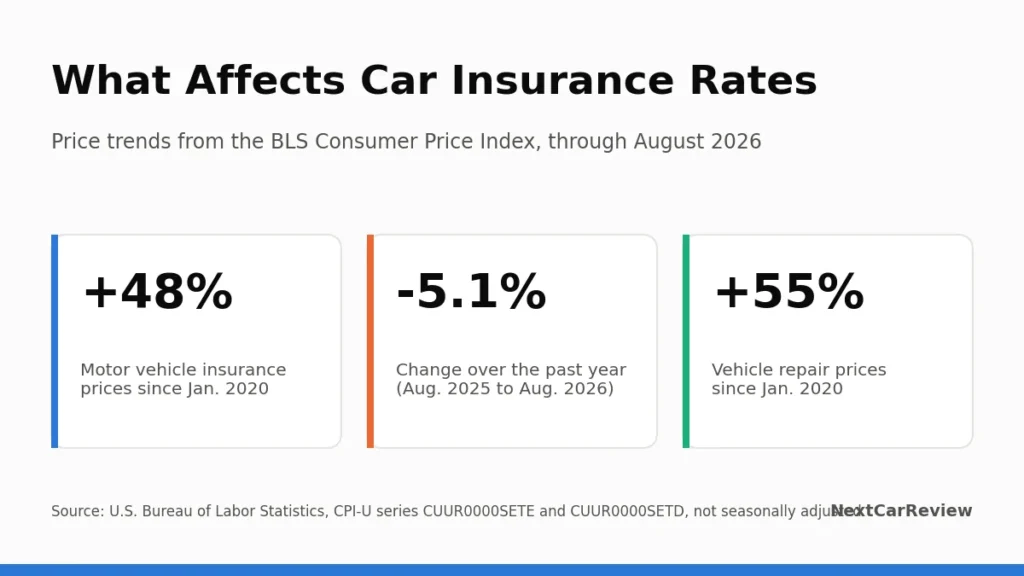
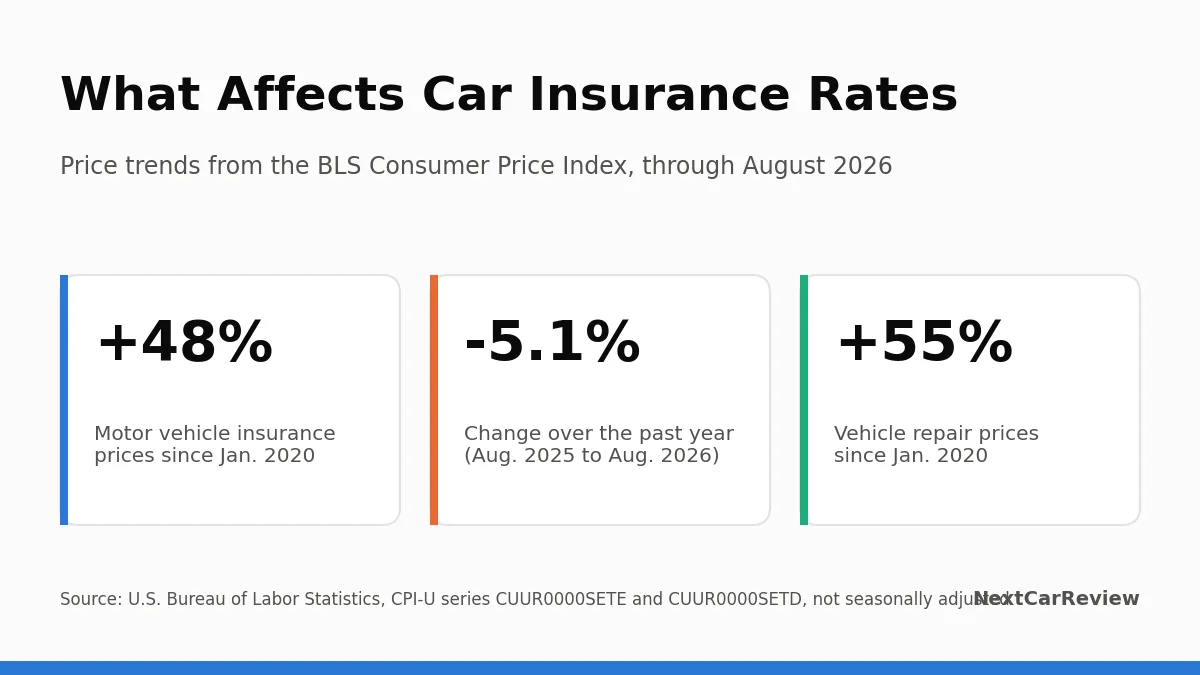
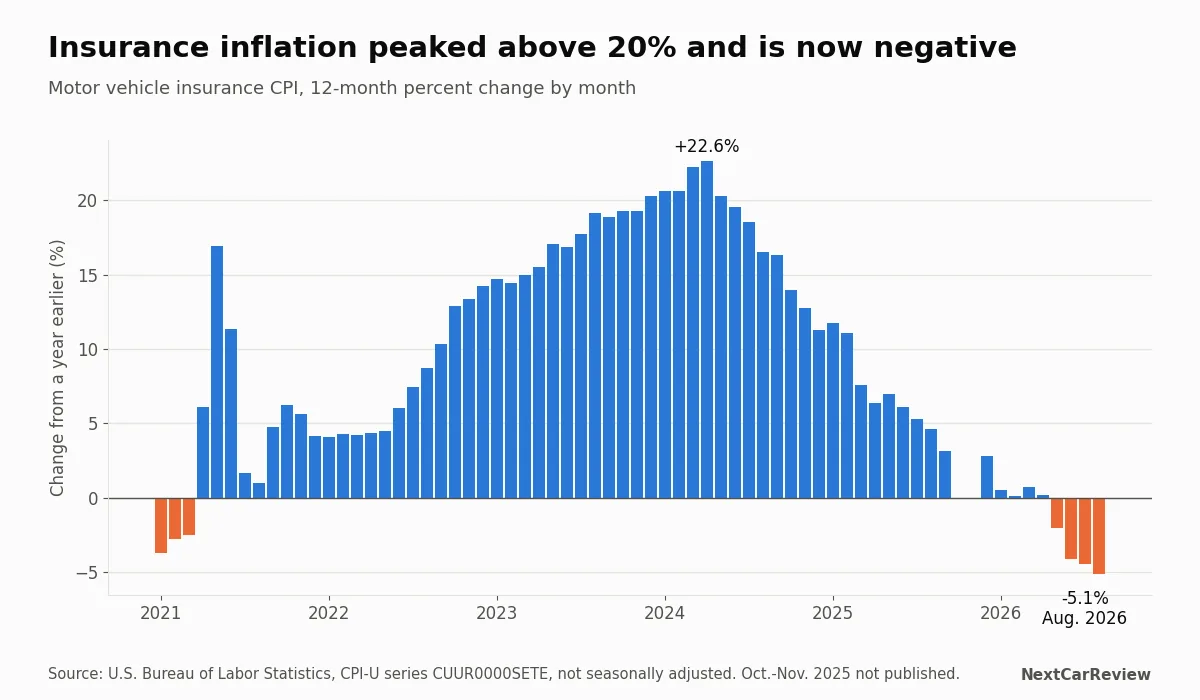
Underneath every individual rate is the cost of claims. The BLS motor vehicle insurance price index rose 48% from January 2020 to August 2026 as repair prices climbed 55%, but it fell 5.1% over the 12 months to August 2026.
Price data comes from the U.S. Bureau of Labor Statistics CPI; rating-factor rules from state insurance law and regulators; vehicle loss data from IIHS-HLDI, linked for reference. NextCarReview does not lend money, sell insurance or test financial products for this guide; see our sourcing policy.
Two drivers with the same car on the same street can be quoted premiums that differ by thousands of dollars. That is not random: insurers price each policy from a rating plan that combines a base rate with a series of factors, and most of those factors multiply rather than add. This guide explains each major factor, what public data says about the overall price trend, and how the NextCarReview auto insurance calculator models the same structure so you can see which levers matter for you.
The Big Picture: Claim Costs Drive Premiums
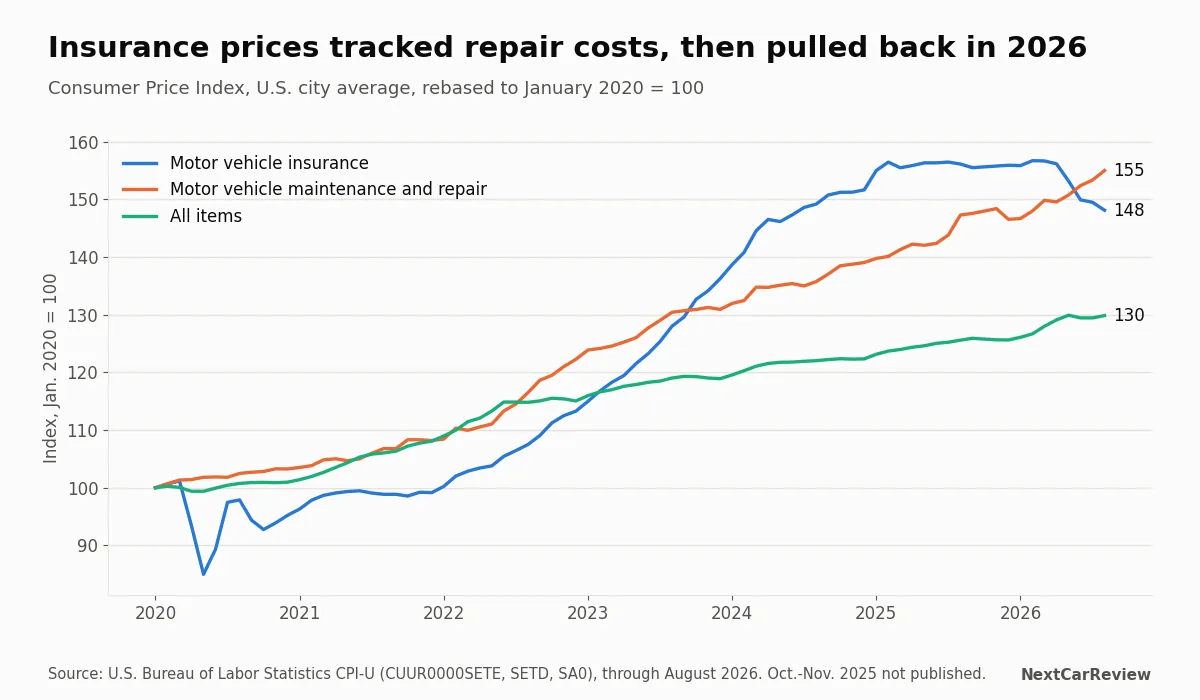
Insurers set rates to cover expected claims plus expenses, and the dominant input since 2021 has been the rising cost of fixing and replacing vehicles. The BLS index for motor vehicle maintenance and repair was about 55% higher in August 2026 than in January 2020, and still rising (5.2% year over year). The motor vehicle insurance index followed with a lag, peaking in February 2026 and easing since.
| BLS CPI series (U.S. city average) | Change Jan. 2020 to Aug. 2026 | Change Aug. 2025 to Aug. 2026 |
|---|---|---|
| Motor vehicle insurance (SETE) | +48.1% | -5.1% |
| Motor vehicle maintenance and repair (SETD) | +55.0% | +5.2% |
| All items (SA0) | +29.9% | +3.4% |
Source: U.S. Bureau of Labor Statistics, CPI-U, not seasonally adjusted. NextCarReview calculations from published index levels.
The Rating Factors, One by One
1. Driving record
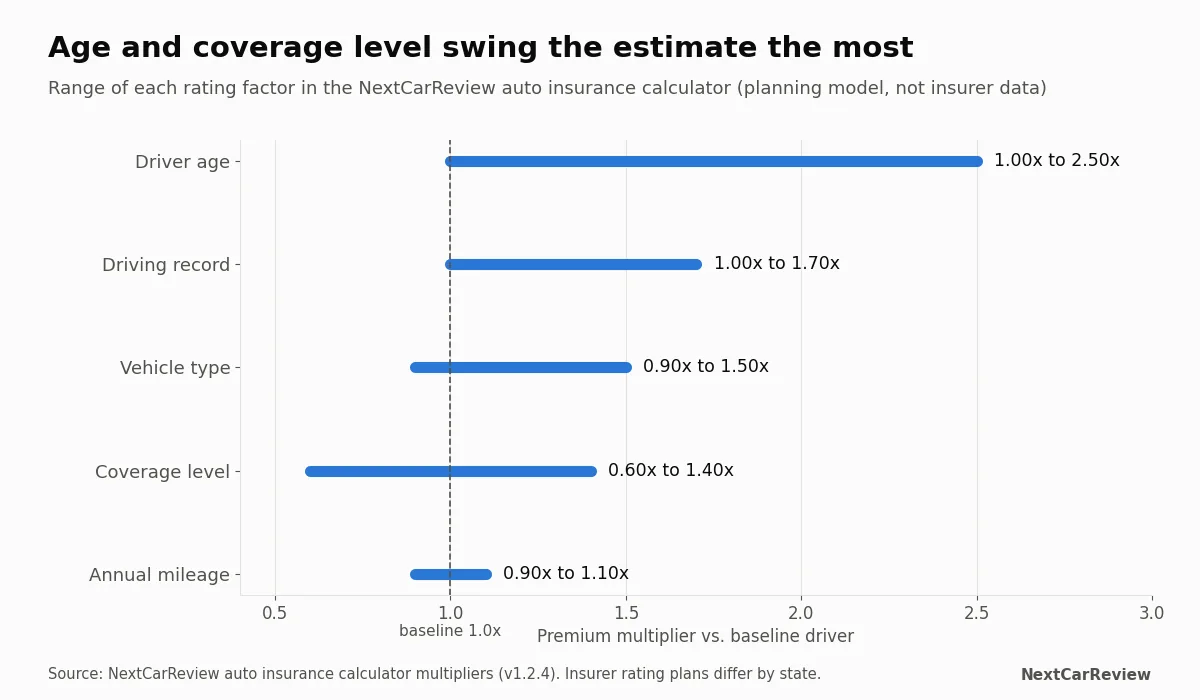
At-fault accidents, speeding tickets and serious violations such as DUI signal higher future claim risk. California’s Proposition 103 makes the driving safety record the most heavily weighted factor in that state, followed by annual miles driven and years of driving experience (Insurance Code section 1861.02). In the NextCarReview calculator, one at-fault accident raises the estimate by 35% and multiple incidents by 70%.
2. Age and driving experience
Young drivers have the highest crash and claim rates, so they pay the most. The calculator applies 2.5 times the baseline for ages 16-19 and 1.8 times for 20-24, easing to 1.1 times at 25-34 and rising slightly again (1.15 times) at 65 and older. Some states, including California, limit or prohibit the use of certain demographic factors, so check your state rules.
3. Where you live and park
Garaging location captures local differences in traffic density, theft, weather, repair labor costs, medical costs and lawsuit frequency, plus each state’s minimum coverage requirements and insurance system (for example, no-fault states). This is why state averages vary so widely; NextCarReview does not reproduce licensed state-average tables, but your state insurance department publishes consumer guides and complaint data.
4. The vehicle
Insurers price models by their own claim history: how often each model generates collision, comprehensive, injury and theft claims and how costly those claims are. IIHS-HLDI publishes these insurance loss results by make and model, with 100 representing the average, so you can compare models before you buy. Sensor-laden bumpers, aluminum panels and expensive parts can raise physical damage costs even on otherwise safe vehicles. The calculator ranges from 0.9 times for economy cars to 1.5 times for sports cars.
5. Coverage choices and deductibles
Carrying only your state’s minimum liability is cheapest (0.6 times in the calculator) but leaves you exposed; adding collision and comprehensive (required by lenders on financed and leased cars) raises the cost, and a higher deductible lowers it.
6. Annual mileage
More miles means more exposure. California law requires insurers to weigh it heavily; elsewhere it is one factor among many, and usage-based programs can measure it directly. The calculator ranges from 0.9 to 1.1 times.
7. Credit-based insurance score
Most states allow insurers to use a credit-based insurance score, which draws on credit report data but is built to predict claims rather than loan default. California, Hawaii and Massachusetts prohibit its use for auto insurance, Michigan restricted it in its 2019 no-fault reform, and several other states limit how it can be used for cancellations and nonrenewals. The NCSL tracks legislation on this issue.
Worked Example: How the Factors Compound
The NextCarReview calculator uses a multiplicative model: estimated annual premium = state base × age × vehicle × coverage × record × mileage, then shows a range of ±15% to reflect how quotes vary between insurers. To keep the example independent of any licensed state-average data, it starts from a hypothetical $2,000 base.
| Factor | Driver A | Multiplier | Driver B | Multiplier |
|---|---|---|---|---|
| Age | 22 | 1.80 | 45 | 1.00 |
| Vehicle | Sports car | 1.50 | Economy car | 0.90 |
| Coverage | Standard | 1.00 | Standard | 1.00 |
| Record | One at-fault accident | 1.35 | Clean | 1.00 |
| Mileage | Average | 1.00 | Low | 0.90 |
| Estimate | $2,000 × 3.645 = $7,290 | $2,000 × 0.81 = $1,620 | ||
| Range (±15%) | $6,197 to $8,384 | $1,377 to $1,863 |
Hypothetical base for illustration only. Multipliers are NextCarReview calculator planning assumptions, not any insurer’s filed rates.
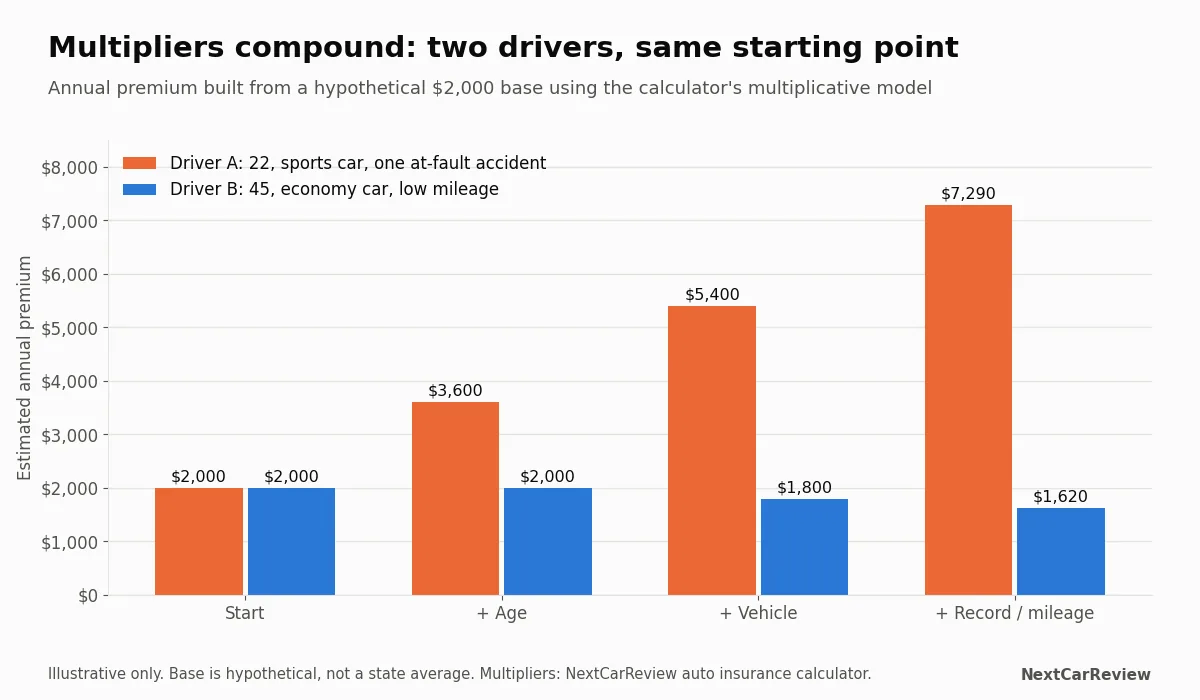
Driver A pays about 4.5 times what Driver B pays from the same starting point. Because the factors multiply, improving any one of them (for example, choosing a less expensive car to insure) cuts the whole premium by that factor’s percentage.
Pick your state, age, vehicle type, coverage, record and mileage to see an estimated range and a factor-by-factor breakdown. Open the calculator →
What You Can and Cannot Control
| Within your control | Mostly outside your control |
|---|---|
| Vehicle choice (check HLDI loss results before buying) | Age and years of experience |
| Coverage limits and deductibles | State insurance laws and minimums |
| Driving record over time | Local repair, medical and litigation costs |
| Annual mileage and usage-based programs | Industry-wide claim cost trends |
| Credit history, where insurers may use it | How each insurer weights factors in its filed plan |
Who Should Pay Closest Attention
- Households adding a teen driver, since age is the largest single multiplier.
- Buyers choosing between models: insurance differences between vehicles can rival differences in fuel cost.
- Drivers with a recent accident or ticket, whose rates may improve as incidents age off their record; check your history and any vehicle you buy with our guide to checking car accident history.
- Anyone renewing: with the national index falling, it is a reasonable time to compare. Our guides to the cheapest auto insurance quotes and how to compare insurance quotes cover the shopping process.
Car Finance Guides
Run your own numbers: auto loan calculator, car payment calculator and auto insurance calculator. More in this series:
Frequently Asked Questions
What affects car insurance rates the most?
Driving record, age and driving experience, where the car is garaged, the vehicle itself, the coverage you choose and, in most states, a credit-based insurance score. California law makes driving record, annual miles and years of driving experience the three most heavily weighted factors.
Why did car insurance get so expensive?
Higher claim costs. The BLS price index for motor vehicle maintenance and repair rose about 55% from January 2020 to August 2026, and the motor vehicle insurance index rose about 48% over the same period, compared with about 30% for all consumer prices.
Are car insurance rates going down?
Nationally, insurance price growth has reversed. The BLS motor vehicle insurance index was 5.1% lower in August 2026 than a year earlier and about 5.5% below its February 2026 peak. Individual premiums still depend on your state, insurer and profile.
Do insurers use my credit score?
In most states insurers may use a credit-based insurance score, which is related to but different from a lending credit score. California, Hawaii and Massachusetts prohibit its use for auto insurance, and Michigan restricted it under its 2019 no-fault reform. Rules vary, so check your state insurance department.
Does the car I buy change my insurance rate?
Yes. Insurers look at how often a model is involved in claims and how much those claims cost. The Highway Loss Data Institute publishes insurance loss results by make and model for collision, injury and theft coverages, which is a useful check before you buy.
How can I estimate my premium before buying a car?
Use the NextCarReview auto insurance calculator to see how age, vehicle type, coverage, driving record and mileage move an estimate, then get real quotes from several insurers for the specific vehicles you are considering.
⚠️ Professional Notice:
This article is general educational information, not insurance or financial advice. National price trends come from BLS CPI data through August 2026 and do not predict any individual premium. Rating factors and their permitted use vary by state and insurer; the multipliers shown are NextCarReview calculator planning assumptions and the $2,000 base is hypothetical. NAIC and IIHS-HLDI materials are cited and linked for reference only. For coverage decisions, consult your state insurance department or a licensed insurance professional.
NextCarReview does not receive compensation from any lender, dealer or insurer for this coverage.
Data Sources and Verification
- U.S. Bureau of Labor Statistics: CPI data and series lookup (CUUR0000SETE, SETD, SA0; through Aug. 2026)
- U.S. Bureau of Labor Statistics: CPI news releases
- California Department of Insurance: auto insurance consumer guides (Prop 103 rating factors)
- California Insurance Code section 1861.02 (mandatory rating factors)
- NCSL: States consider limits on insurers’ use of consumer credit information
- IIHS-HLDI: Insurance losses by make and model
- NAIC: A Consumer’s Guide to Auto Insurance (linked for reference; not reproduced)
- NextCarReview auto insurance calculator (rating multipliers used in examples)
Figures were checked against the sources above between September 15 and October 3, 2026. Rates, prices and laws change; verify before you rely on them.

Morgan Reyes is the founder and editor-in-chief of NextCarReview, which Morgan launched in August 2024. A 2022 graduate of Columbia University, Morgan is based in New York and writes and edits the site’s reviews, comparisons and buying guides. Morgan does not road-test vehicles. Every article is built from published primary data: EPA FuelEconomy.gov ratings, NHTSA crash ratings, recalls and owner complaints, IIHS results, and manufacturer specifications and pricing, with each figure cited and checked before publication. Contact: admin@nextcarreview.com