In this article 8 sections
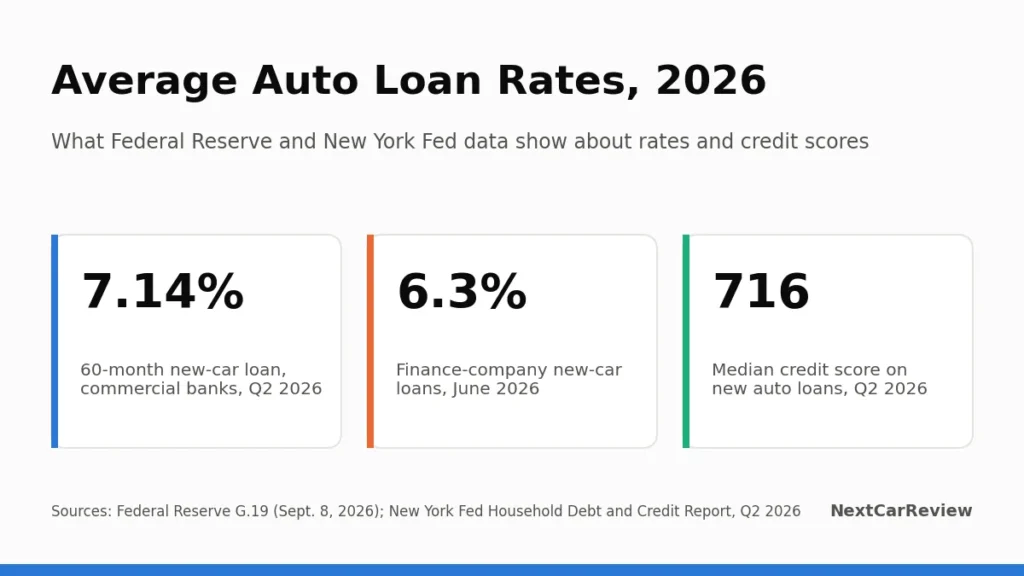
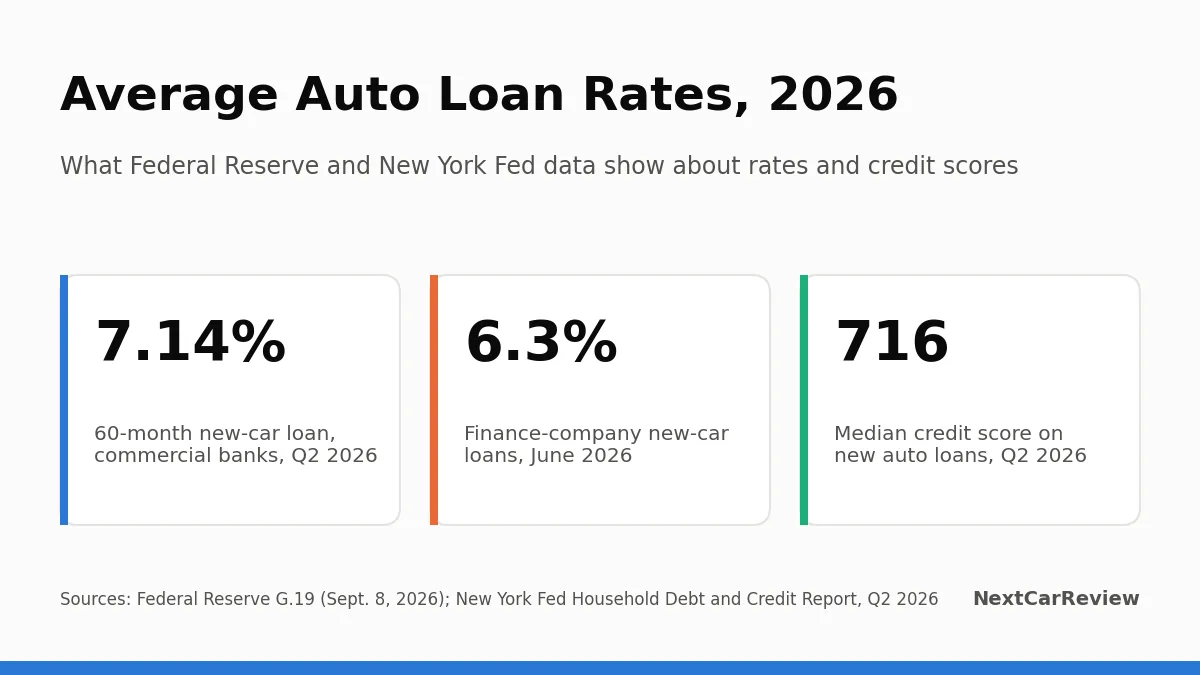
Federal Reserve data released September 8, 2026 put the average 60-month new-car loan at commercial banks at 7.14% APR (Q2 2026), the 72-month loan at 6.97%, and finance-company new-car loans at 6.3% (June 2026) with a 67-month average term and $41,705 average amount financed.
No federal agency publishes rates by credit score. Federal data does show the median auto borrower in Q2 2026 had a 716 credit score, and CFPB research found subprime borrowers paid about 10% at banks versus 15% to 20% at finance companies and buy-here-pay-here dealers. On a $41,705 loan, moving from a 6.5% to an 18.5% APR adds about $15,264 in interest over five years.
Rate data comes from the Federal Reserve G.19 release; credit-score distributions come from the New York Fed Household Debt and Credit Report; lender-type and score research comes from the CFPB. NextCarReview does not lend money, sell insurance or test financial products for this guide; see our sourcing policy.
“What rate will I get?” is the first financing question most buyers ask, and the honest answer is that it depends mostly on two things you can see before you set foot in a dealership: your credit score and where you borrow. This guide pulls together what public federal data actually says about auto loan rates in 2026, explains why there is no official “rate by credit score” table, and shows how much each tier costs in real dollars using the same amortization math as the NextCarReview auto loan calculator.
Average Auto Loan Rates in 2026: The Federal Numbers
The Federal Reserve’s monthly G.19 Consumer Credit release includes a “Terms of Credit” table with two separate auto loan series. Commercial bank rates come from a quarterly survey and are reported for the middle month of each quarter; finance-company rates (a group that includes automakers’ captive finance arms) are reported monthly.
| Series (new-car loans) | 2024 avg | 2025 avg | Q1 2026 | Q2 2026 |
|---|---|---|---|---|
| Commercial banks, 60-month APR | 8.16% | 7.65% | 7.53% | 7.14% |
| Commercial banks, 72-month APR | 8.29% | 7.80% | 7.53% | 6.97% |
| Finance companies, APR | 6.2% | 6.4% | 6.2% | 6.3% |
| Finance companies, average term | 66 mo | 66 mo | 67 mo | 67 mo |
| Finance companies, average amount financed | $39,386 | $40,582 | $41,727 | $41,705 |
Source: Federal Reserve G.19, Terms of Credit, not seasonally adjusted, released Sept. 8, 2026. Commercial bank Q2 figure is the May 2026 survey; finance-company figures for Q2 match the June 2026 reading.
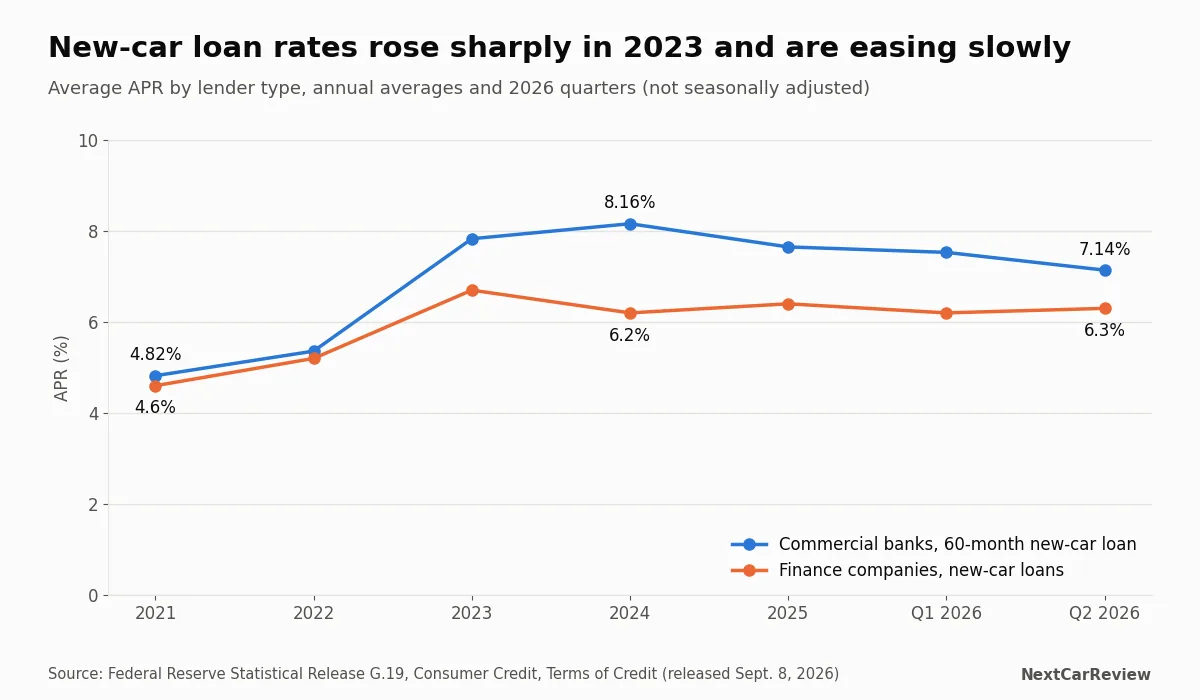
Two patterns stand out. First, bank rates climbed from 4.82% in 2021 to a peak of 8.16% in 2024 and have eased about one percentage point since. Second, finance-company averages run below bank averages. That is not because finance companies are cheaper for everyone: automakers’ captive lenders can subsidize rates on new vehicles as a sales incentive, which pulls the average down, and those promotional deals generally go to applicants with strong credit. Our guide to 0% financing for 72 months covers how those offers work.
Why There Is No Official “Rate by Credit Score” Table
G.19 averages every borrower together. The tier-by-tier rate tables that circulate online come from private sources, most prominently Experian’s quarterly State of the Automotive Finance Market report, which is licensed data. NextCarReview cites it by name rather than reproducing its figures; you can view the current edition on Experian’s site. What the public record does show is how credit scores shape who borrows, what they pay, and how loans perform.
Who is borrowing: originations by credit score
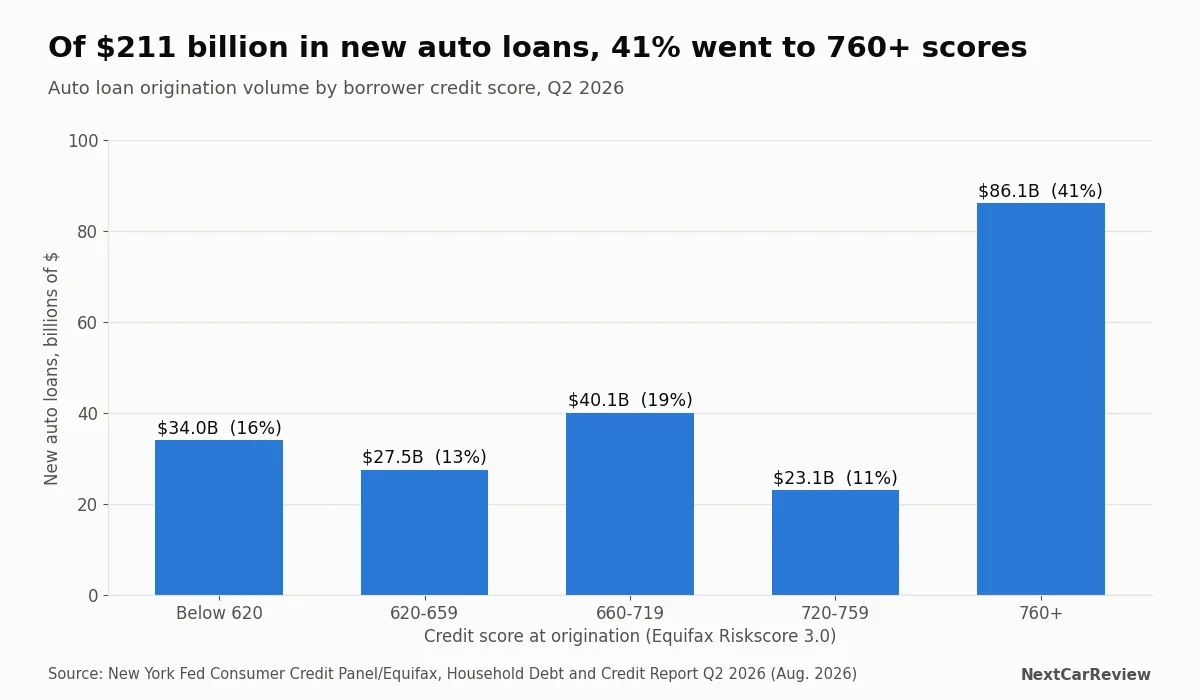
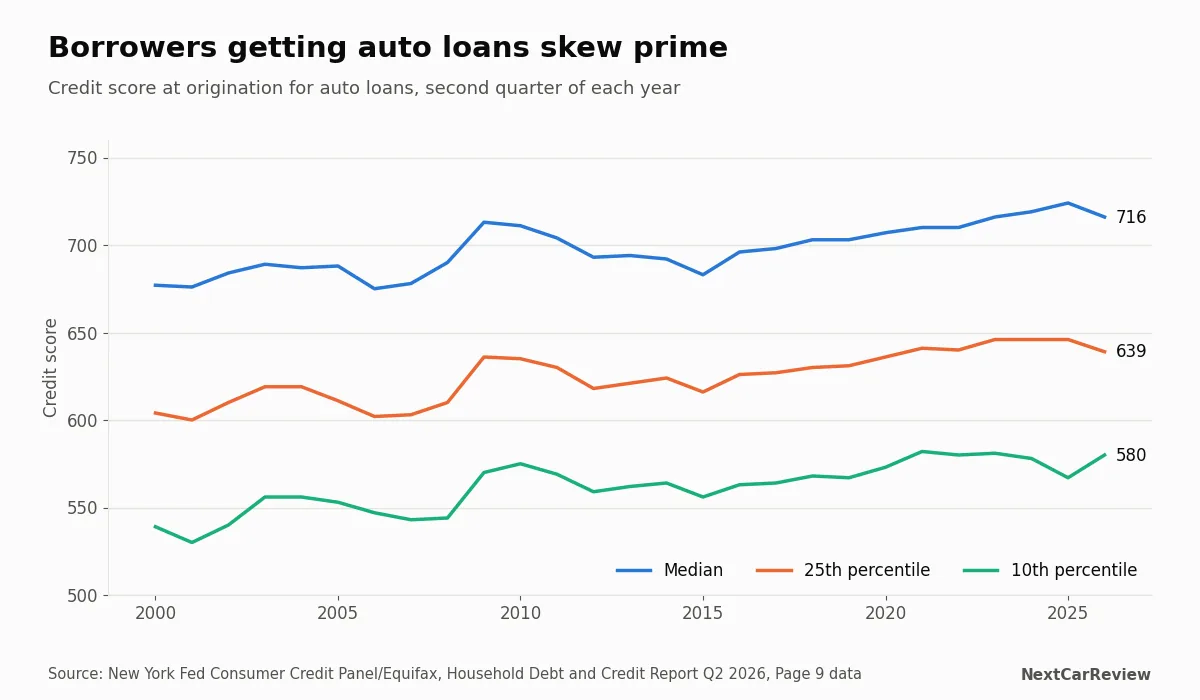
The New York Fed’s Consumer Credit Panel (built from Equifax data) tracked $211 billion in new auto loans in the second quarter of 2026, a record in nominal terms. The median borrower’s score was 716.
| Credit score band | Q2 2026 originations | Share of dollars |
|---|---|---|
| Below 620 | $34.0 billion | 16.1% |
| 620-659 | $27.5 billion | 13.1% |
| 660-719 | $40.1 billion | 19.0% |
| 720-759 | $23.1 billion | 10.9% |
| 760+ | $86.1 billion | 40.9% |
Source: New York Fed Consumer Credit Panel/Equifax, Household Debt and Credit Report Q2 2026 (Equifax Riskscore 3.0).
What different borrowers pay: CFPB evidence
The Consumer Financial Protection Bureau has published several loan-level studies that link scores to pricing:
- Lender type matters as much as score for subprime borrowers. In the CFPB’s 2021 Data Point on subprime auto loans (loans originated 2014 through 2016), average rates for subprime loans were about 10% at banks versus 15% to 20% at finance companies and buy-here-pay-here dealerships. The share of subprime loans that became 60 or more days delinquent within three years was about 15% at banks versus 25% to 40% at the other lender types.
- Lower-score borrowers paid nearly double. In the CFPB’s January 2025 servicemember auto finance report, non-servicemember borrowers whose vehicles were later repossessed had an average score of 629 and an average APR of 12.9%, while those who were not repossessed averaged a 726 score and 6.6% APR.
- Used cars cost more to finance. The same report found 2018-2022 average APRs of 7.1% to 10.2% for used-vehicle loans versus 3.5% to 6.4% for new-vehicle loans.
The CFPB lists your credit scores and history, your income and debts, the loan amount, the loan term, your down payment relative to the vehicle’s value, and the type of vehicle (including whether it is new or used) as the main inputs to the rate you are offered. A dealer can also add a markup when it arranges financing through a third-party lender, which is one reason to arrive with a pre-approval.
What Each Credit Tier Costs: Worked Example
The NextCarReview auto loan calculator pre-fills an APR when you pick a credit tier. Those defaults are editorial planning assumptions, not quotes or survey data, so treat them as a starting point and replace them with a real pre-approval. The math below uses them with the G.19 average amount financed of $41,705 and a 60-month term.
Formula: monthly payment = P × r(1 + r)n / ((1 + r)n − 1), where P is the amount financed, r is the APR divided by 12, and n is the number of months. Total interest = payment × n − P.
Example at 6.5% APR: r = 0.065 / 12 = 0.0054167; (1 + r)60 = 1.3828. Payment = $41,705 × 0.0054167 × 1.3828 / 0.3828 = $816.01. Total paid = $816.01 × 60 = $48,960, so interest is about $7,255.
| Calculator tier (score) | New-car APR default | Monthly payment | Total interest, 60 mo | Total interest, 72 mo |
|---|---|---|---|---|
| Excellent (720+) | 6.5% | $816.01 | $7,255 | $8,771 |
| Good (690-719) | 7.8% | $841.64 | $8,793 | $10,650 |
| Fair (660-689) | 10.5% | $896.40 | $12,079 | $14,684 |
| Poor (620-659) | 13.5% | $959.63 | $15,873 | $19,368 |
| Deep subprime (Below 620) | 18.5% | $1,070.41 | $22,520 | $27,633 |
Calculated on $41,705 financed. APRs are NextCarReview calculator defaults for planning only; your quoted rate will differ.
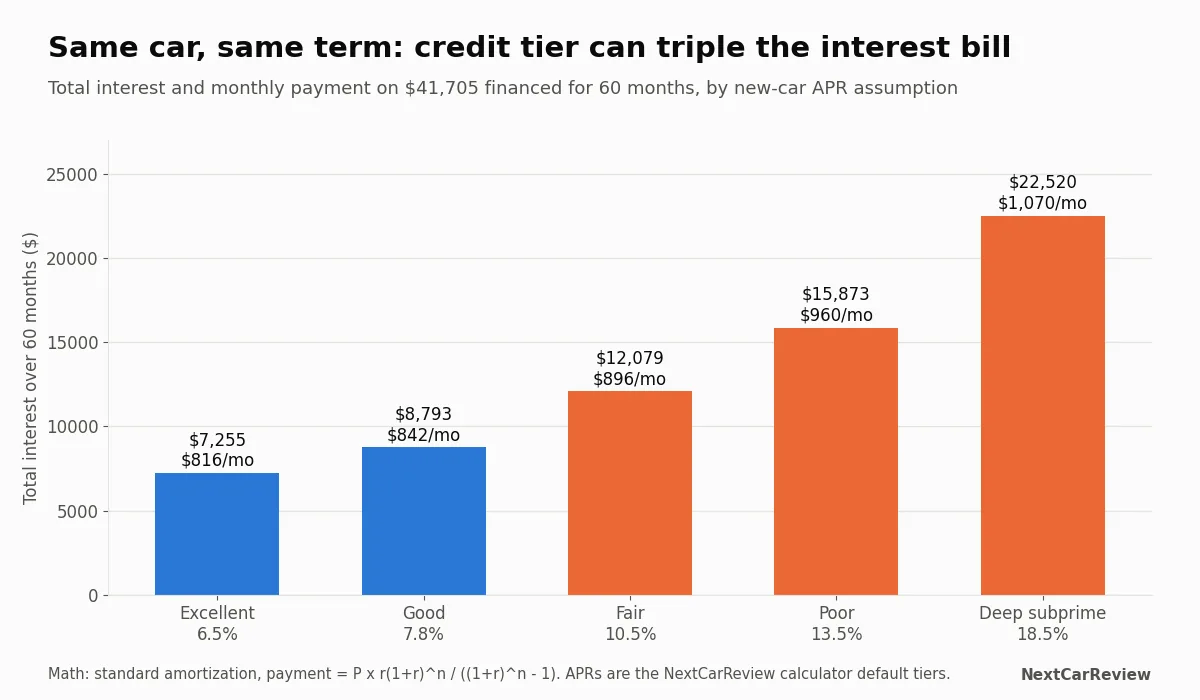
The spread is large: the gap between the Excellent and Deep subprime assumptions is about $254 a month and $15,264 over five years. Stretching to 72 months lowers each payment but adds interest in every tier.
Enter your price, state tax, down payment and a real APR quote to see the payment, total interest and full amortization schedule. Open the calculator →
How to Get a Rate Below Your Tier’s Average
- Check your credit reports first. Errors on a report can push you into a worse tier. Reports are free at AnnualCreditReport.com.
- Get two or three pre-approvals in a short window. The CFPB notes that auto loan inquiries within 14 to 45 days are generally counted as one, so rate shopping has little effect on your score.
- Include a credit union. The CFPB lists banks, credit unions and online lenders as alternatives to dealer-arranged financing; compare each quote with the G.19 averages above.
- Shorten the term. In the G.19 data, 72-month bank loans are priced close to 60-month loans, but the extra year still adds interest, as the table shows.
- Let the dealer try to beat your pre-approval, and compare the APR and amount financed, not just the monthly payment.
Pros and Cons of Financing at Today’s Rates
| Pros | Cons |
|---|---|
| Bank rates have eased from the 2024 peak (8.16% to 7.14% on 60-month loans) | Rates are still well above 2021 levels (4.82%) |
| Captive promotional rates pull new-car averages down for strong credit | Promotional rates usually require top-tier credit and may replace cash rebates |
| Rate shopping within 14-45 days barely affects your score | Subprime borrowers at finance companies and BHPH lots pay far more and default more often |
Who This Guide Is For
- Buyers with a score near a tier boundary deciding whether to wait and improve their credit before financing.
- First-time buyers who want a reality check before visiting a dealer (see also our first-car buying guide).
- Anyone comparing a dealer offer with a bank or credit union pre-approval. Our walkthrough of the car loan calculator explains each input.
Car Finance Guides
Run your own numbers: auto loan calculator, car payment calculator and auto insurance calculator. More in this series:
Frequently Asked Questions
What is the average auto loan rate right now?
The Federal Reserve’s G.19 release of September 8, 2026 shows commercial banks averaged 7.14% on 60-month new-car loans and 6.97% on 72-month loans in the second quarter of 2026. Finance companies, which include automakers’ captive lenders, averaged 6.3% on new-car loans in June 2026.
Does the Federal Reserve publish auto loan rates by credit score?
No. G.19 reports average rates by lender type and term, not by borrower credit score. Rates by score tier are published by private credit bureaus and data firms such as Experian, whose figures are licensed. Federal sources (the New York Fed and the CFPB) do show how loan volume and outcomes differ by score.
What credit score do most auto borrowers have?
In the second quarter of 2026, the median credit score on newly originated auto loans was 716 (Equifax Riskscore 3.0), according to the New York Fed. The 25th percentile was 639 and the 10th percentile was 580.
How much does a lower credit score cost on a car loan?
On $41,705 financed for 60 months, total interest is about $7,255 at 6.5% APR and about $22,520 at 18.5% APR, a difference of roughly $15,264. The monthly payment rises from about $816 to about $1,070.
Will shopping several lenders hurt my credit score?
Generally very little. The CFPB says auto loan credit inquiries made within a 14- to 45-day window are typically treated as a single inquiry by common scoring models, so comparing several offers in a short period is usually worth it.
Are used-car loan rates higher than new-car rates?
Yes, typically. CFPB analysis of loans originated from 2018 to 2022 found average APRs for used-vehicle loans in the 7.1% to 10.2% range versus 3.5% to 6.4% for new-vehicle loans, a gap of more than 3 percentage points in every month studied.
⚠️ Professional Notice:
This article is general educational information, not financial, credit or legal advice. Average rates come from the Federal Reserve G.19 release of September 8, 2026 and New York Fed data for Q2 2026; your offered rate depends on your credit file, income, the vehicle and the lender. The credit-tier APRs used in the worked examples are NextCarReview calculator planning defaults, not survey data or offers. Consult a qualified financial professional for advice on your situation. This page is scheduled for a quarterly data refresh.
NextCarReview does not receive compensation from any lender, dealer or insurer for this coverage.
Data Sources and Verification
- Federal Reserve G.19 Consumer Credit release, Terms of Credit (Sept. 8, 2026)
- New York Fed Household Debt and Credit Report, Q2 2026 (Aug. 11, 2026)
- New York Fed press release: Household debt, Q2 2026
- CFPB Data Point: Subprime Auto Loan Outcomes by Lender Type (Sept. 2021)
- CFPB: Auto lending to servicemembers report (Jan. 2025)
- CFPB: How does a lender decide what interest rate to offer me on an auto loan?
- CFPB: How will shopping for an auto loan affect my credit?
- CFPB: Where can I get information on auto loan rates?
- Experian State of the Automotive Finance Market (licensed data, cited by name only)
Figures were checked against the sources above between September 15 and October 3, 2026. Rates, prices and laws change; verify before you rely on them.

Morgan Reyes is the founder and editor-in-chief of NextCarReview, which Morgan launched in August 2024. A 2022 graduate of Columbia University, Morgan is based in New York and writes and edits the site’s reviews, comparisons and buying guides. Morgan does not road-test vehicles. Every article is built from published primary data: EPA FuelEconomy.gov ratings, NHTSA crash ratings, recalls and owner complaints, IIHS results, and manufacturer specifications and pricing, with each figure cited and checked before publication. Contact: admin@nextcarreview.com